North Shore Rental Market Report - July 2026
This month's headlines
- Average asking rents rose for the fifth consecutive month, up +0.2% to $2,752, recovering from January's $2,691 low.
- Rents remain −2.1% below a year ago as supply surges: 5,764 homes were available to rent across the service area, up 22.2% on last year and the highest level in the thirteen months of our series.
- Reading (+8.9%), Manchester by the Sea (+6.1%) and North Reading (+5.8%) lead annual growth among established markets, while the Merrimack Valley stays soft (Haverhill −8.0%, Lawrence −7.0%).
- Family homes hold firm: 3-bed rents are just −0.3% down on the year at $3,367, against −2.3% for 1-beds. Larger homes remain the scarcest stock on the market.
- Homes take longer to let than a year ago, at an average of 31.8 days on the market against 27.6 last June, though the pace has quickened markedly since December's peak of 37.8 days.
Summary
The North Shore rental market is finding its footing. The average asking rent across all 45 towns and cities of Boston's North Shore reached $2,752 this month, the fifth monthly rise in a row since the January low of $2,691, though still −2.1% below the $2,810 recorded a year earlier.
The story behind the annual fall is supply, not demand. Tenants could choose from 5,764 available homes, 22.2% more than a year ago. More choice means more competition among landlords, and asking rents have adjusted accordingly, particularly for 1-bed homes, where availability is greatest.
Asking rents & supply
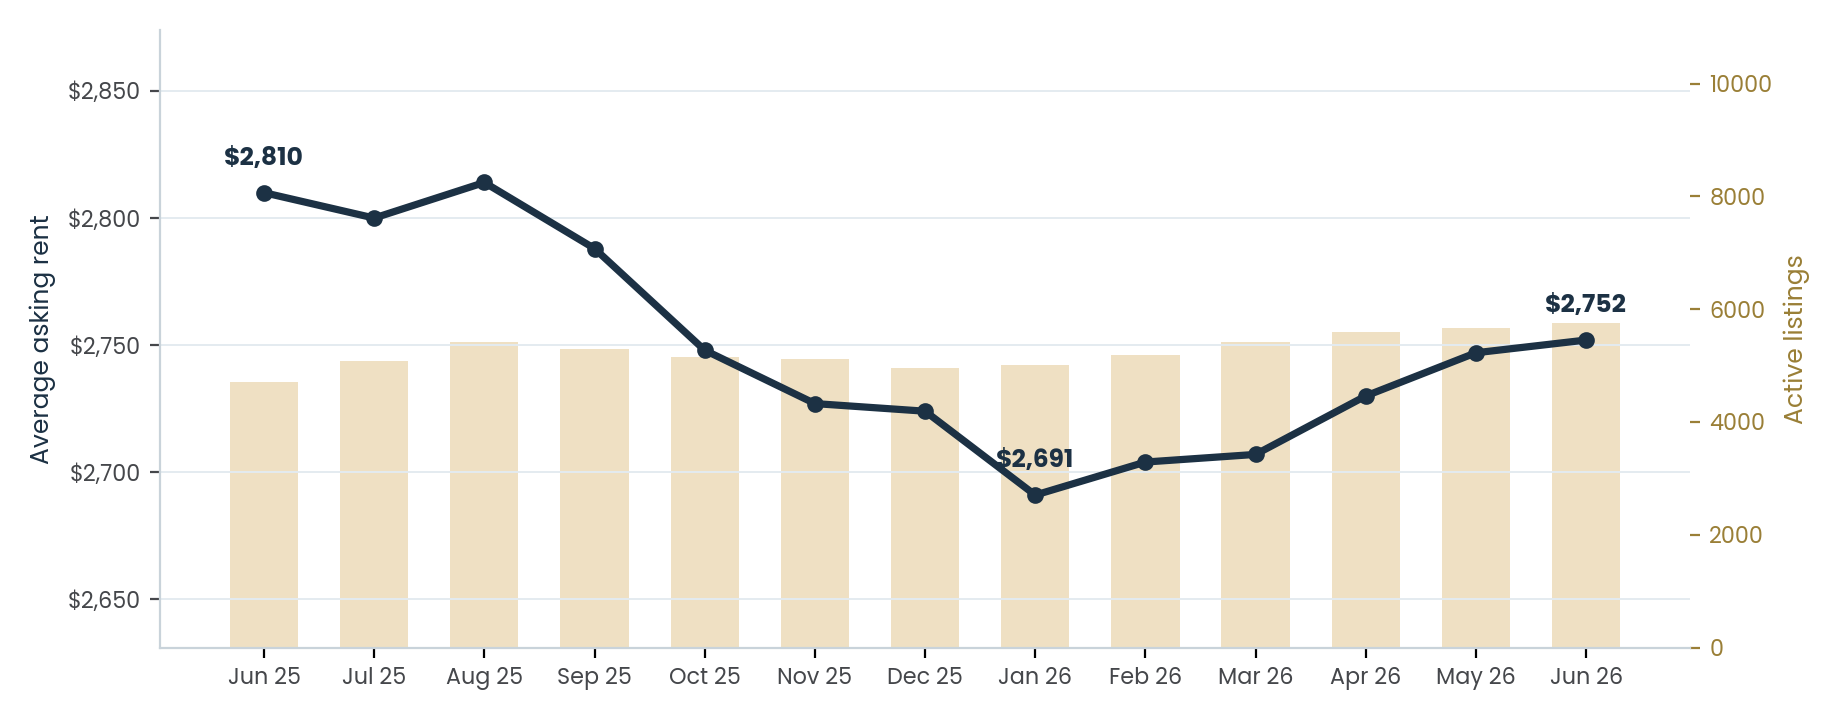
Navy line: average asking rent across the full service area. Gold bars: active listings.
Time to let
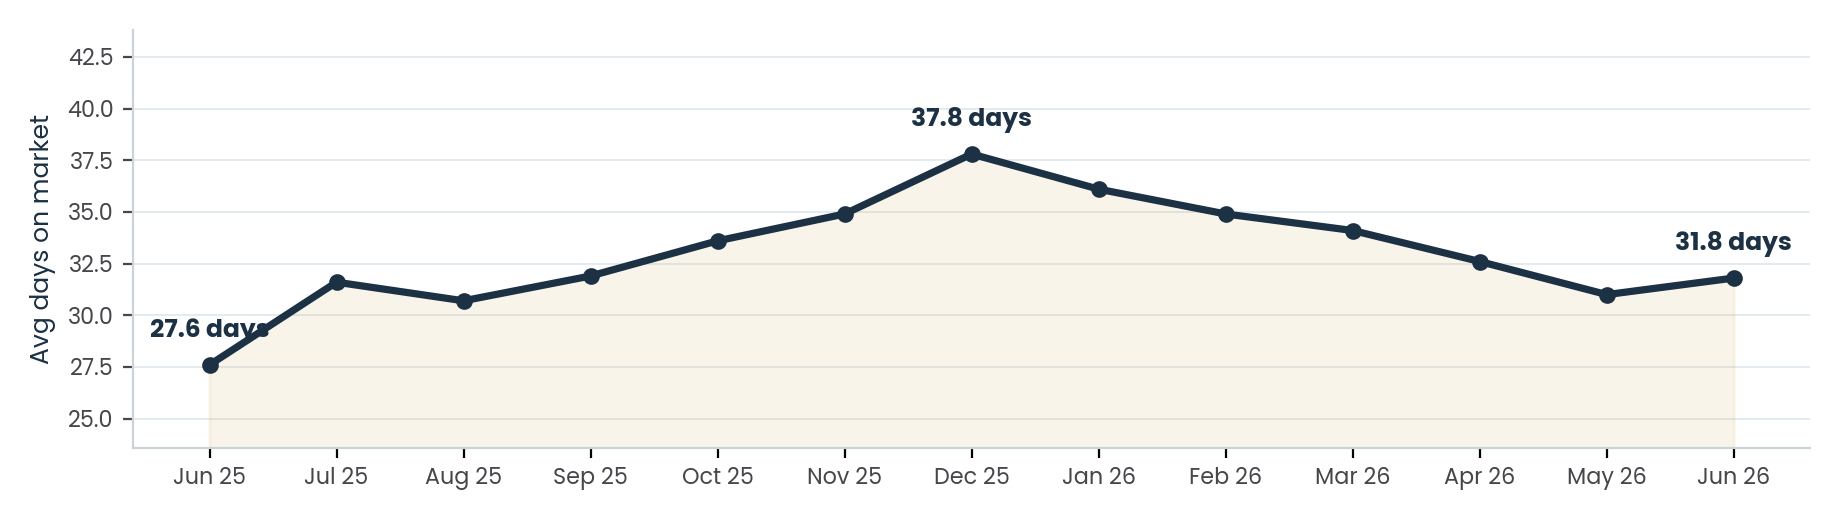
Average days on the market of active rental listings, weighted by listing volume across the service area.
Supply has been the defining force in this market for a year, and both charts tell the same story. Available homes climbed from 4,715 last June to 5,764 today, and as stock accumulated, letting slowed: the average listing took 37.8 days to let by December, ten days longer than a year before. The spring letting season has absorbed much of that pressure. Asking rents have risen every month since January, time to let has quickened to 31.8 days, and the gap to last year's rent level has narrowed for four consecutive months. One nuance for owners of larger homes: 3-beds command the firmest rents but move slowest, at 41 days on average against 27 for 1-beds, so patience and presentation matter most at the family end of the market.
Annual change by town
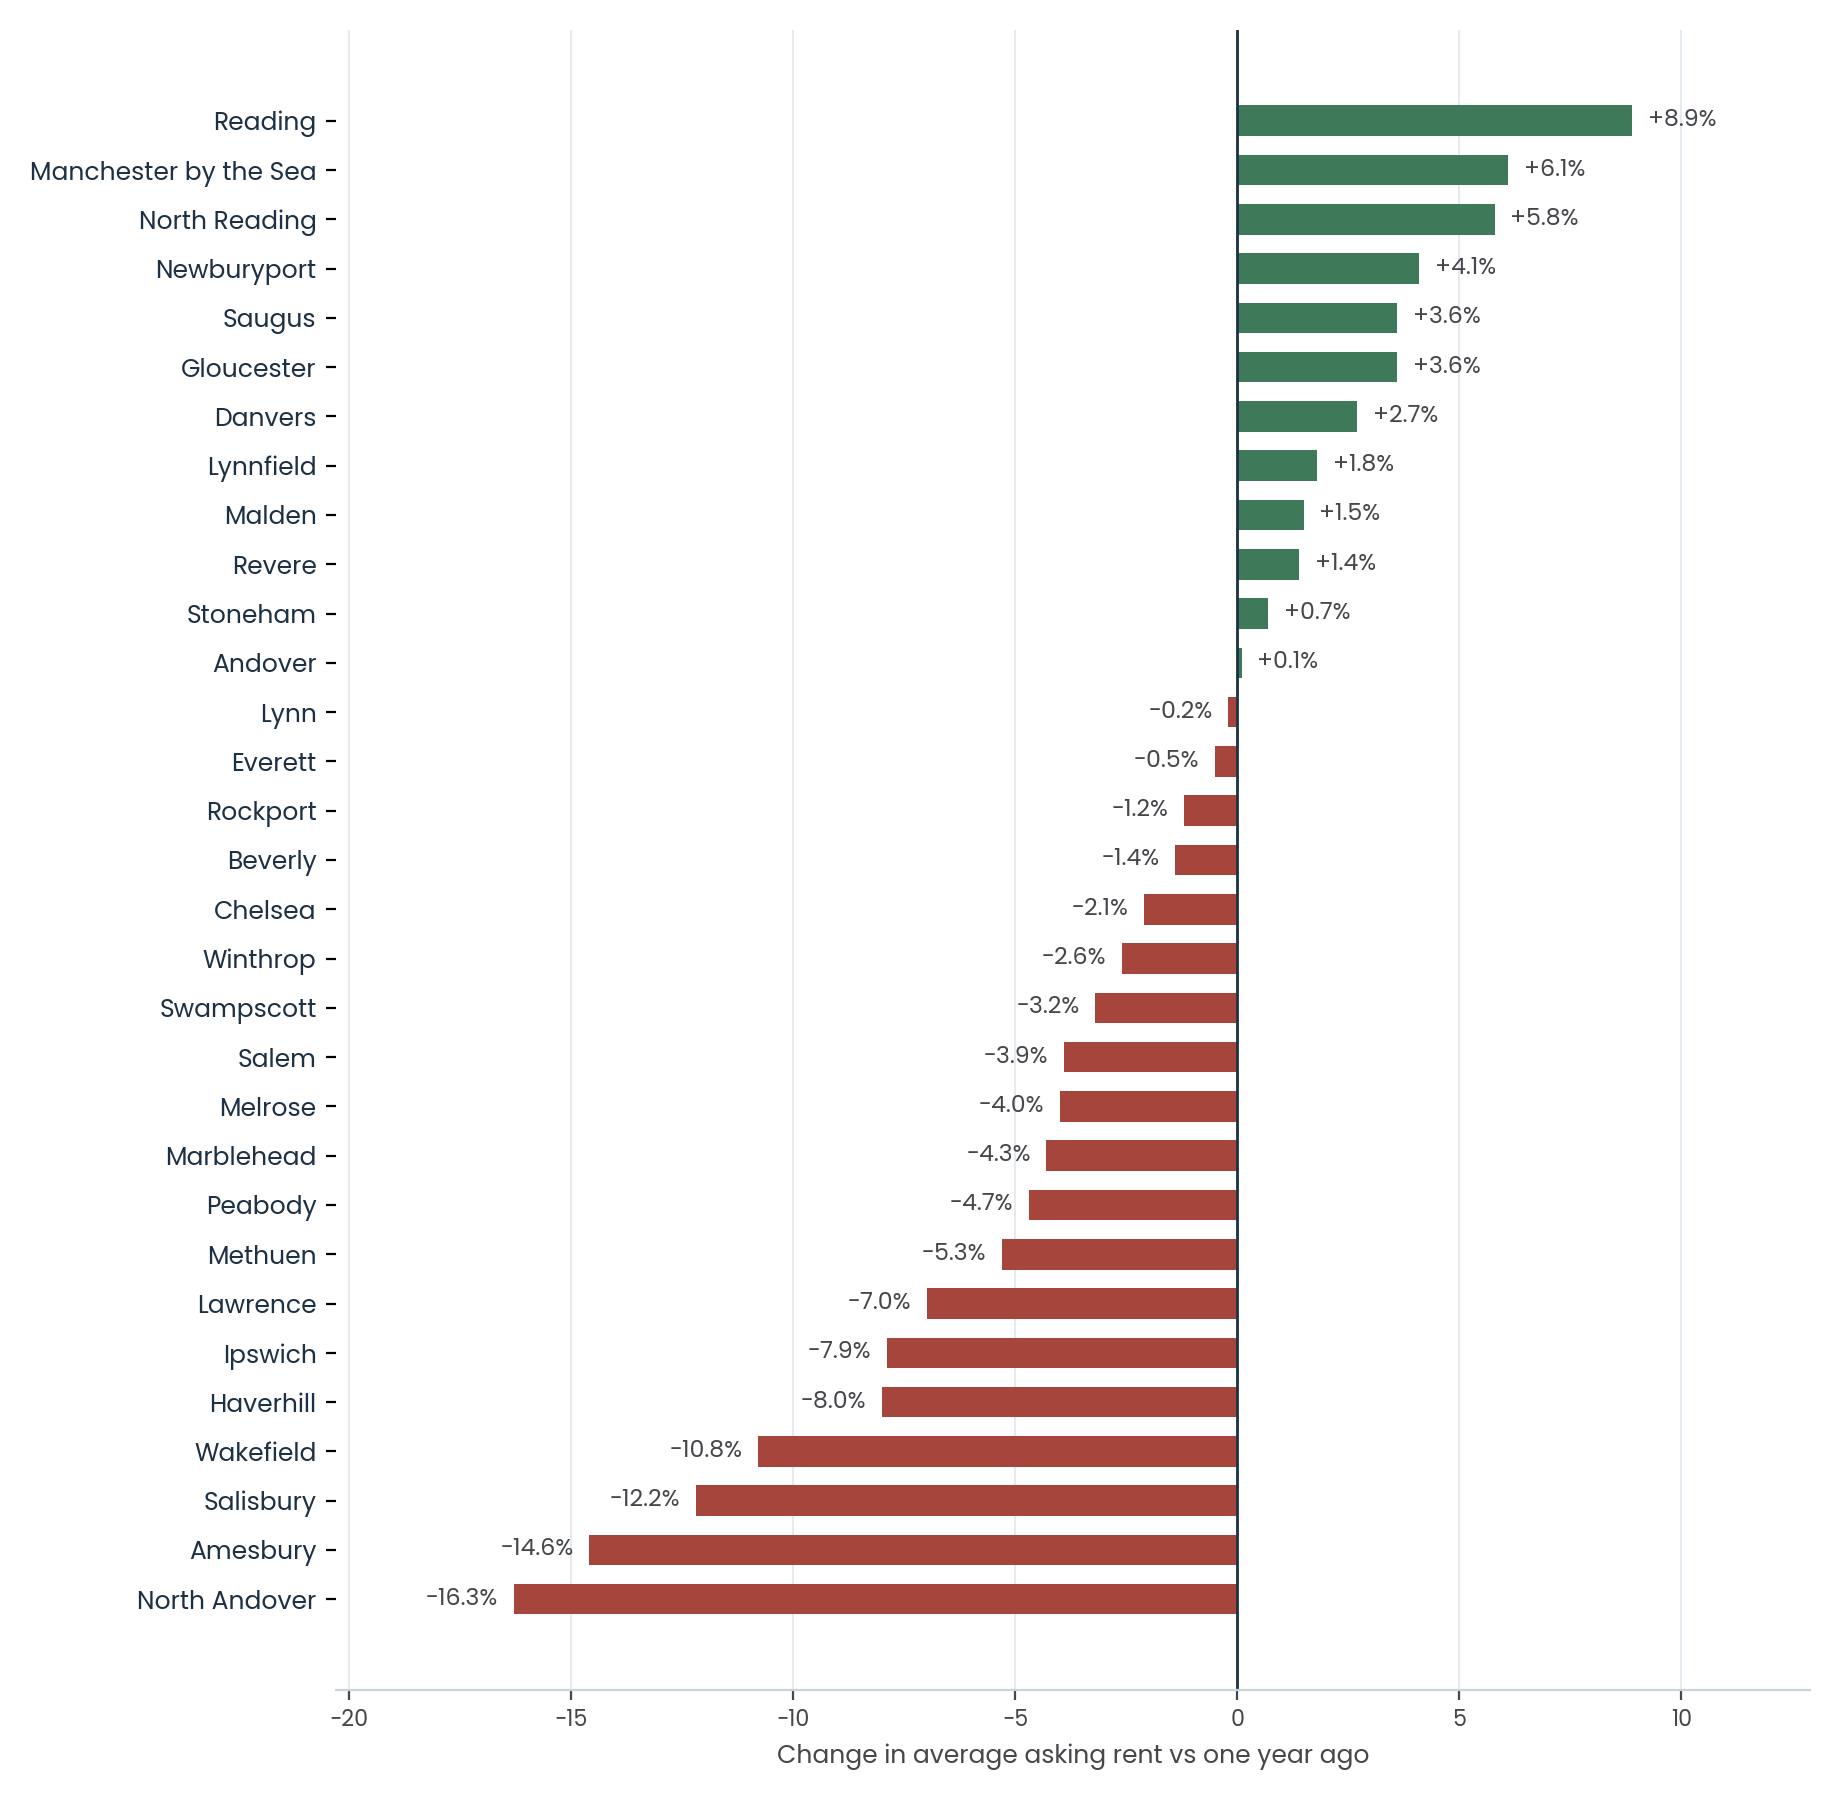
Towns with fewer than 10 active listings are excluded from this chart, as small samples produce outsized swings; their figures appear in full in the table below. North Andover's fall is measured against an unusually small base skewed by premium units last year.
Comment from Chelworths
“A 2.1% annual fall reflects a market digesting far more supply rather than one in retreat. Tenants had more than a fifth more homes to choose from than last summer, and the adjustment has been orderly: rents have now risen for five consecutive months. Because tenants can compare so easily, well-presented homes priced against this month's asking rents are still letting quickly, while overpriced or tired stock sits. Landlords approaching summer renewals should benchmark against their own town's figures in the table below rather than the headline. A Newburyport 3-bed and a Haverhill 1-bed are living in very different markets right now, and an empty month costs far more than a modest adjustment.”
Liam Davies Chelworths Property ManagementAverage asking rents by town & size
| TOWN | 1 BED | 2 BED | 3 BED | ||||||
|---|---|---|---|---|---|---|---|---|---|
| Rent | MoM | YoY | Rent | MoM | YoY | Rent | MoM | YoY | |
| Amesbury | $2,521 | -5.8% | +0.0% | $2,900 | -5.1% | -21.9% | $3,425* | -13.8% | +15.6% |
| Andover | $2,341 | -0.7% | +1.0% | $2,888 | +2.2% | -4.6% | $4,124 | -0.4% | -5.5% |
| Beverly | $2,345 | -1.4% | -1.4% | $2,800 | -0.3% | -10.7% | $3,530 | +0.0% | +2.7% |
| Boxford | — | — | — | — | — | — | — | — | — |
| Byfield | — | — | — | $3,148* | +0.0% | — | — | — | — |
| Chelsea | $2,551 | -2.5% | -0.3% | $2,989 | -1.1% | -0.1% | $3,209 | -1.3% | -1.7% |
| Danvers | $2,434 | +1.1% | -3.0% | $3,032 | +1.7% | +0.9% | $3,958 | -2.2% | +6.4% |
| Essex | $2,000* | +0.0% | +3.9% | $2,675* | -10.8% | -36.3% | $4,500* | +2.3% | — |
| Everett | $2,605 | -0.8% | -1.3% | $3,200 | +0.5% | -3.1% | $3,123 | -7.2% | -1.2% |
| Georgetown | $2,240* | +0.0% | — | $2,198* | +0.0% | +9.9% | $3,867* | -13.6% | — |
| Gloucester | $2,149 | +0.5% | -3.1% | $2,696 | -5.2% | +12.9% | $4,111 | +14.2% | +18.0% |
| Groveland | $2,495* | -3.9% | +38.6% | $2,500* | — | — | $3,100* | — | +3.3% |
| Hamilton | $2,450* | +0.0% | +11.4% | — | — | — | — | — | — |
| Haverhill | $1,961 | +1.8% | -0.3% | $2,365 | +1.6% | -9.6% | $2,570 | -1.3% | -1.8% |
| Ipswich | $2,036* | +0.0% | -25.2% | $3,140* | -16.6% | -0.6% | $3,883* | -0.4% | +11.9% |
| Lawrence | $1,777 | -10.3% | -14.0% | $2,422 | +0.4% | -5.0% | $2,654 | -0.3% | -1.6% |
| Lynn | $2,135 | +0.5% | -3.2% | $2,537 | -0.3% | -2.6% | $2,986 | -1.3% | +1.2% |
| Lynnfield | $2,954 | -1.2% | +6.4% | $3,656 | -5.6% | -10.0% | — | — | — |
| Malden | $2,420 | -1.7% | +3.1% | $2,957 | -1.0% | -0.5% | $3,180 | -0.8% | -1.7% |
| Manchester by the Sea | $3,082* | -5.2% | +26.7% | $3,962* | -2.8% | +8.3% | $6,750* | +0.4% | +40.6% |
| Marblehead | $2,298 | -4.7% | +16.6% | $3,220 | -2.0% | +4.4% | $5,559 | +1.8% | +13.4% |
| Melrose | $2,653 | +0.3% | -4.6% | $3,365 | -0.4% | +0.6% | $3,586 | +6.9% | -0.2% |
| Merrimac | $2,250* | -15.1% | — | $3,400* | +6.6% | +20.4% | — | — | — |
| Methuen | $2,047 | -0.3% | -6.1% | $2,680 | +4.1% | +3.1% | $2,745 | +4.5% | -11.8% |
| Middleton | — | — | — | $3,500* | +7.3% | — | $4,250* | +11.8% | +25.0% |
| Nahant | $2,333* | +8.8% | +13.8% | $3,075* | +0.0% | — | — | — | — |
| Newbury | $3,300* | +6.5% | -5.7% | — | — | — | $3,700* | +5.9% | -29.5% |
| Newburyport | $2,565 | +4.7% | +3.5% | $3,560 | -3.5% | -3.7% | $3,985 | -7.3% | -0.4% |
| North Andover | $2,453 | +0.6% | -49.0% | $2,812 | +1.2% | +11.3% | $3,299 | +0.9% | +10.0% |
| North Reading | $2,447 | +0.2% | +2.5% | $2,960 | -1.5% | -2.8% | — | — | — |
| Peabody | $2,429 | -1.9% | -7.4% | $2,961 | +2.6% | -2.3% | $3,787 | +10.3% | +2.2% |
| Reading | $2,130* | +6.1% | -2.2% | $3,358 | +6.8% | +18.0% | $4,244* | +2.4% | +1.7% |
| Revere | $2,527 | +0.2% | +0.1% | $3,120 | -1.1% | +0.9% | $3,439 | -1.1% | -1.3% |
| Rockport | $2,850* | -2.3% | +27.0% | $3,592* | +21.2% | -2.6% | $3,462* | -0.5% | -11.6% |
| Rowley | — | — | — | $2,200* | +6.8% | -6.4% | $3,950* | — | — |
| Salem | $2,314 | -0.3% | -3.3% | $2,926 | +0.5% | -4.1% | $3,310 | +3.1% | +2.0% |
| Salisbury | $2,158* | +0.1% | -12.8% | $2,534* | +2.2% | +0.4% | $2,988* | -2.9% | -16.2% |
| Saugus | $2,579 | +0.6% | +3.0% | $3,172 | +2.5% | +1.8% | $3,397 | +2.3% | -1.0% |
| Stoneham | $2,791 | -5.0% | -6.0% | $3,302 | +1.6% | +0.3% | $3,629* | +1.3% | -1.0% |
| Swampscott | $2,614 | +2.0% | -4.4% | $3,198 | +0.8% | +1.6% | $4,166 | -6.9% | +2.9% |
| Topsfield | — | — | — | $2,300* | -8.0% | — | $3,600* | +0.0% | — |
| Wakefield | $2,342 | -0.8% | -9.4% | $3,057 | +6.0% | -2.0% | $3,607 | -1.0% | -13.8% |
| Wenham | $2,900* | +0.0% | — | $3,200* | -5.9% | -20.0% | — | — | — |
| West Newbury | — | — | — | $3,200* | +0.0% | — | — | — | — |
| Winthrop | $2,314 | +0.7% | +5.9% | $2,671 | -1.3% | -2.5% | $3,562 | +3.5% | -1.8% |
* based on fewer than 10 active listings; read with caution. — no data available for this size or comparison period.
Methodology
The Chelworths North Shore Rent Report is compiled from residential rental listings data supplied by RentCast, covering the full Chelworths service area: 45 towns and cities across 52 ZIP codes on Boston's North Shore. This edition reports the calendar month ending June 30, 2026, with monthly and annual comparisons to May 2026 and June 2025. Figures are average asking rents, not achieved rents, finalized at month end. Multi-ZIP towns (Haverhill, Lawrence, Lynn) are combined using listings-weighted averages. All available data is published; figures built on fewer than 10 active listings are marked with an asterisk, as small samples can move sharply for compositional reasons. Figures are provided for general information only and do not constitute an appraisal, valuation, or investment advice.
Sign up free